Ari Meier
Data Analyst
About Me
I love digging into data to find insights that help businesses grow and work more efficiently.
With solid skills in SQL, Python, and data visualization, I turn complex data into clear, meaningful stories that support smart decisions.
Skills
- Skills: Data Analysis, Statistical Analysis, Regression Analysis, Hypothesis Testing, Data Storytelling, Collaboration, Problem Solving, Advanced LLM Prompting
- Technologies: SQL, Advanced Microsoft Excel, Python, Tableau, Google Analytics, Looker Studio, Google Search Console, SEMrush, Google Tag Manager, Screaming Frog
- Interests: Art, writing, musician (piano), learning violin, and cello, architecture, mathematics, community development
Featured Projects
SQL
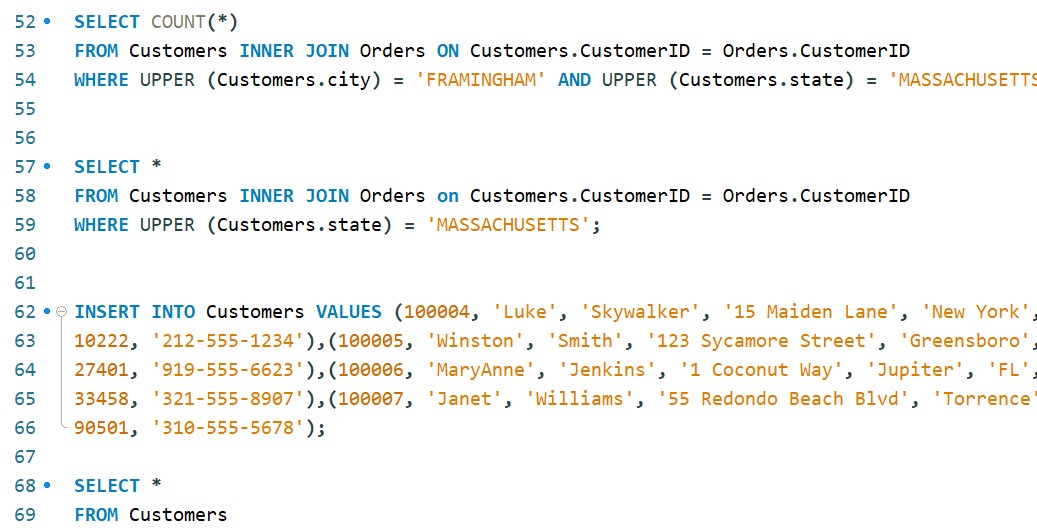
Database Creation, Import and Querying
This organization’s fragmented data was unified with a custom database, enabling efficient tracking, reporting, and improved data integrity.
R | Modeling
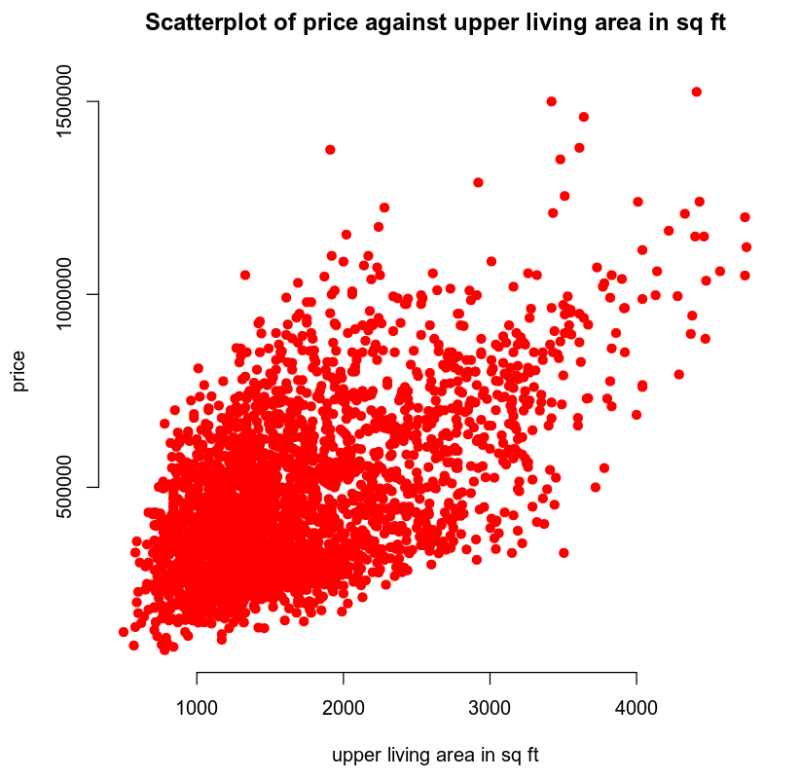
Housing data analysis: Square footage vs. bedrooms on price (regression models)
Multiple regression, qualitative variables interactions, and quadratic regression models were created to analyze key house features to set optimal listing prices for faster sales.
R | Modeling
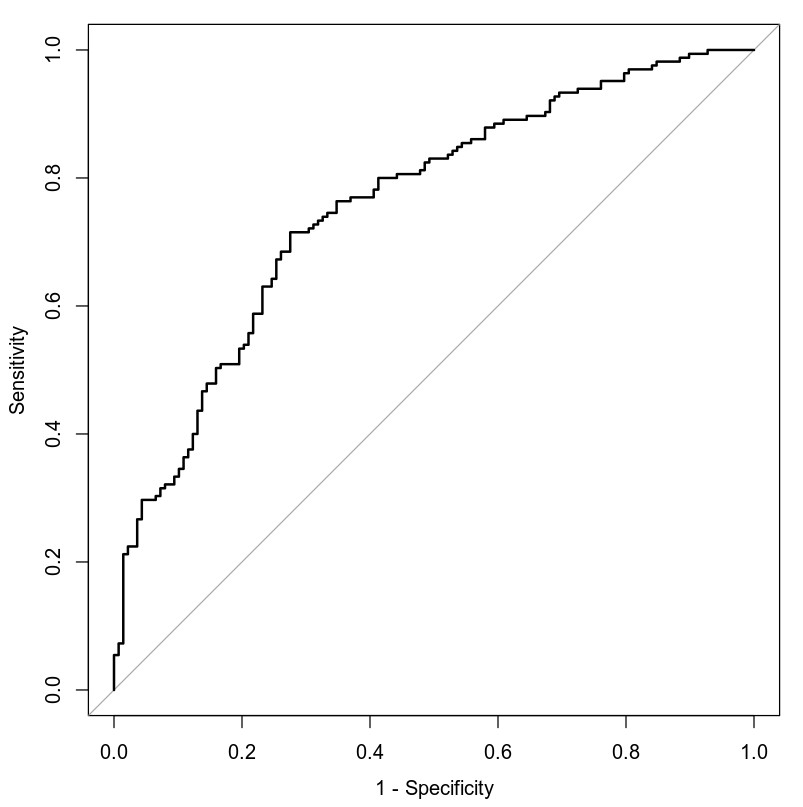
Predicting heart disease risk factors using machine learning models
Logistic Regression and Random Forests were created to analyze
heart disease data to predict risk factors.
Data Journalism
Data articles, covering topics from city comparisons and economic development to social issues like the opioid crisis and marriage trends.
© Ari Meier Data Portfolio. All rights reserved.


